Have you heard of the expression “flying blind?” It’s not a good way to run a business. If you don’t know where you’re going or what is happening at key moments, you’re likely to crash. Mobile apps work the same way.
The best process to improve a mobile app starts with collecting and accurately interpreting user data. Without insights from the information you collect, your team won’t know how users move through your app or what adjustments are needed to increase conversions.
Mobile apps are similar to websites regarding what types of data are collected. Watching the right metrics allows you to make small tweaks to your design and content that will optimize the value of your app for users—and help you exceed your business goals.
Getting started with mobile analytics may seem overwhelming at first, so this post will walk you through the basics of how it works and some of the popular options you’ll want to consider.
How Mobile Analytics Works?
It’s possible to track the flow of how each user moves through your app, what features they use, what purchases they make and how often they use it. This data is helpful in allowing your team to know what features should be highlighted and solving problems such as low conversion rates. Every app is different, so not all metrics are weighted equally for every business. For example, a game app is probably more focused on in-app purchases than a healthcare app that’s focused on patient-doctor relationships.
Most mobile apps track launch and uninstall rates. Launch data can show you the first time each user opens an app after installing it. This is a critical metric, because if users aren’t opening the app right when they get it, there may be a compatibility issue with their devices. Uninstall rates are also valuable because you can follow the sequence of actions a user took to understand why they didn’t keep the app.
Additionally, there are a number of metrics you’ll want to monitor between the time a user first installs an app and when they delete it. Some of the most common ones are listed below:
Clicks: Any button or link that can be clicked or tapped can be tracked. This is important because you can create a timeline showing how each user moves through your app. If you see patterns in users not clicking on certain features or buttons, you’ll be able to conduct small experiments to see what increases click rates.
Audience Data: Aside from logging the location of each user, you can collect information about gender, the type of device they’re using and completion of tasks you assign them, such as setting up an account. Groups of users can also be segmented according to how often they use the app and how much money they spend.
Purchases: Beyond seeing when a user makes an in-app purchase, you can track each item that is sold as well as what gets abandoned in shopping carts. Abandoned carts can then become the focus on remarketing campaigns and discount offers to drive more sales conversions.
Conversions: Most businesses tend to focus on sales conversions in their apps, but you can identify other events that are useful to track. Some options include linking a social media account, redeeming a coupon, inviting a friend, or adding a payment method.
In addition to the standard types of metrics listed above, most enterprise-ready mobile app analytics tools provide customization options as well. This makes it possible to create custom metrics that specifically relate to the features and goals of your app.
Enterprise-Ready Solutions: Firebase, Mixpanel and Flurry
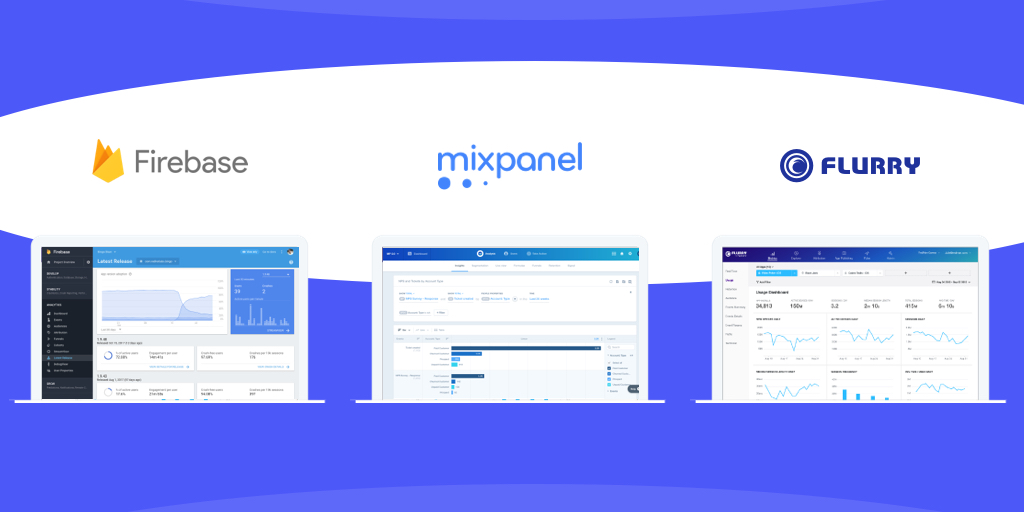
All three of these platforms provide similar analytics services, but their prices and depth of features vary. Some notable differences are highlighted below:
- Firebase
- Mixpanel
- Flurry
Firebase: Since it’s a Google product, many of the features you need are free, but there are also pay-as-you-go options based on how much data and storage you use. Prices are low and the service integrates flawlessly with other Google products, but it doesn’t offer the kind of personalized assistance you can get from other providers.

Price: Free
Platforms/Device Supported: iOS, Android
Mixpanel: You’ll find the best user interface and dashboards of the group here, but it’s also the most expensive option. However, Mixpanel has made customer service and UX a priority, so it’s a good option if you want the best overall experience.

Price: Free + Premium (click here for prices)
Platforms/Device Supported: Android & iOS
Flurry: Unlike the two other options listed, Flurry is completely free. It includes the metrics you would expect along with customization options, but its interface and dashboards aren’t as user-friendly as what you’ll find in Firebase or Mixpanel.

Price: Free
Platforms/Device Supported: iOS, Android, Java ME, Blackberry, Windows Phone.
Which Mobile App Analytics Platform Should You Choose?
As a rule of thumb, if you need analytics for a small or midsize app, then Firebase is the best to use due to lower costs and it generally being easy to integrate with other services. But if you have a large social media app, Mixpanel is the better option because its visualizations will make conversion optimization simpler to track and manage.
Innovation Starts With Blue Whale Apps
Blue Whale Apps is a full-service development firm that helps organizations add machine learning, IoT integrations, augmented reality and other custom solutions to their offerings.
Our team can handle all parts of the development process, from reviewing where you are now, to making and implementing a plan for where you want to go. We specialize in end-to-end development for Fortune 1000 businesses and government agencies, including consulting, branding, UX design and hand-crafted code.
Blue Whale Apps’s Mobile App Analytics experts ensure enhanced user engagement with our proven mobile analytics services.
Ready to Discuss Your Project?
We integrate high-end analytics tools to help you analyze user engagement and improve the performance of your iOS and Android apps for smartphones, tablets, wearables, smart TV and others.


